Figuring out how many grow lights you need starts with one decision: measure your plant canopy, not your room walls. Once you know your canopy dimensions and target PPFD for the growth stage you’re running, our Grow Light Coverage Calculator does the rest—estimating fixture count, average PPFD, and Daily Light Integral (DLI) for any setup, from a 2′ x 2′ tent to a 200-square-foot commercial room.
Whether you’re dialing in your first grow tent or planning a multi-room facility upgrade, this guide walks through the exact inputs the calculator needs, what the outputs mean, and how to apply them to select the right fixtures for your space.
These principles apply at any scale. Home growers can use the foundational sections on PPFD, DLI, and fixture placement to optimize a single tent. Commercial operators will find detailed scale-specific guidance in the Commercial Workflow section below.
Use the Grow Light Coverage Calculator
How to use it:
1.) Enter your canopy Length and Width in feet (measure the plant footprint, not the room)
2.) Enter your room’s Ceiling height (for context)
3.) Select a Fixture Preset (generic class with typical PPF and footprint) or use Advanced mode to input your fixture’s exact PPF from the spec sheet
4.) Set your Hang Height — the distance from your canopy to the underside of the fixture
5.) Enter the Number of Fixtures you’re considering
6.) Set Overlap % — 10–20% is standard for better uniformity at canopy edges
7.) Enter Hours/day photoperiod (used to calculate DLI)
8.) Hit Calculate — the tool returns average PPFD (µmol/m²/s), DLI (mol/m²/day), total wattage, and recommended fixture count
Why You Measure Canopy, Not Room Size
The most common sizing mistake is using the full room dimensions as the input. Your room’s walls and walkways don’t photosynthesize. What matters is the actual surface area your plant canopy occupies — and this number is often significantly smaller than the room footprint, especially in commercial facilities with aisles, rolling benches, or perimeter walkways.
If you’re growing in a 4′ x 8′ tent, your canopy is your input. If you’re running a 20′ x 20′ room with a 4-foot perimeter cleared for equipment access, your canopy footprint might be closer to 12′ x 12′. Run the calculator against your actual plant footprint and your fixture count will be more accurate for real plant area.
PPFD: The Right Way to Measure Light Intensity
PPFD (Photosynthetic Photon Flux Density), measured in µmol/m²/s, tells you how much usable light is hitting your canopy surface every second. It is a far more precise metric for plant growth decisions than watts alone, since different fixture types (LED, HPS, CMH) deliver very different amounts of usable light per watt consumed.
Target PPFD ranges by growth stage (cannabis, 70–80°F, standard CO₂ ~400–800 ppm):
Important: These ranges assume standard ambient CO₂ (~400–800 ppm) unless otherwise noted. Pushing PPFD much above ~900 µmol/m²/s without CO₂ enrichment to match generally will not increase yield and increases the risk of light stress; plants reach a light saturation point where additional photons are mostly converted to heat.
DLI: The Full-Spectrum Picture
DLI (Daily Light Integral) is the total amount of photosynthetically active light your plants receive over a full 24-hour period. DLI is calculated from PPFD and your photoperiod:
- DLI = PPFD × 3.6 × Hours/Day ÷ 1,000
So a fixture delivering 800 µmol/m²/s under a 12-hour flowering photoperiod produces a DLI of approximately 34.6 mol/m²/day.
Target DLI ranges for cannabis:
Our calculator includes automatic DLI estimation — enter your photoperiod hours and it does the math. DLI is especially useful for comparing different fixture-and-schedule combinations: sometimes adjusting run time by 1–2 hours achieves a target DLI more efficiently than adding another fixture.
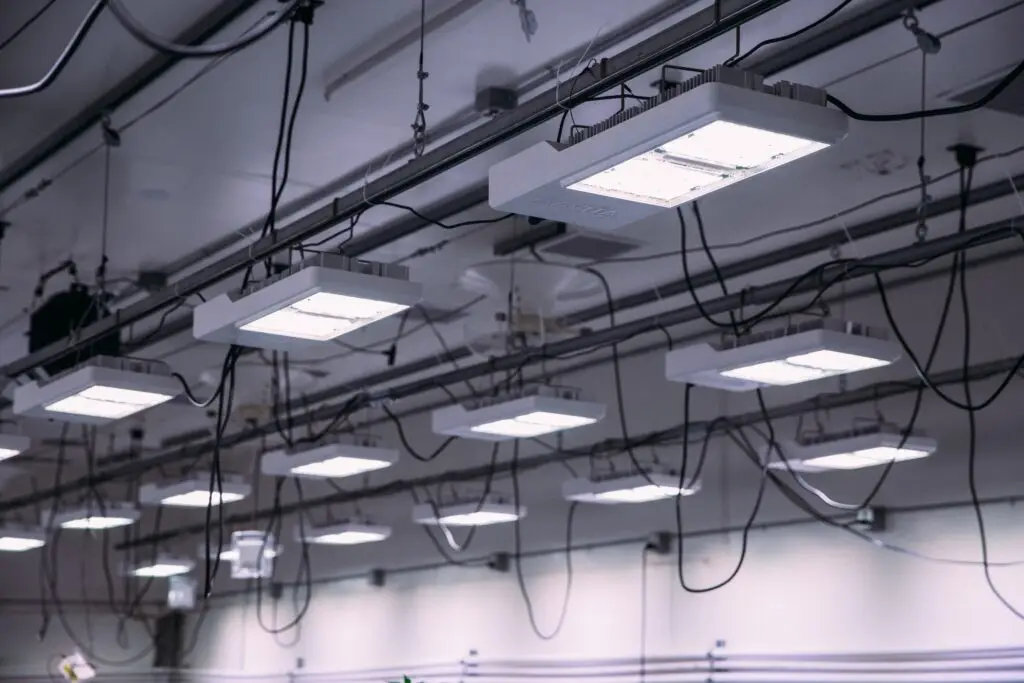
LED vs. HPS: What the Calculator Requires
Modern LED grow lights now dominate indoor cannabis cultivation for both hobby and commercial operations due to their efficiency (µmol/J), full-spectrum output, lower heat load, and utility rebate eligibility (DLC certification). LEDs have a higher upfront cost but deliver more usable light per watt and can reduce HVAC load compared to equivalent HPS systems when designed correctly.
When using the Advanced mode:
- LED fixtures: Input actual PPF (µmol/s) from the manufacturer spec sheet — not “equivalent wattage.” Modern high-efficiency 600–650W-class LEDs commonly specify total output in the ~1,800–2,100 µmol/s range; always rely on your specific fixture’s published PPF and recommended mounting height. Fixtures are rated at a reference hang height; inputting your actual hang height lets the calculator adjust footprint coverage accordingly.
- HPS fixtures: Refer to your fixture’s PPF. Many
- double-ended HPS systems
- in the 1,000W class deliver PPF in the ~1,800–2,100 µmol/s range with significantly more radiant heat output than comparable LEDs, so factor in HVAC load and room design when comparing lifecycle costs.
Fixture Selection: Primary Products
Growers Choice ROI-FF 650 Watt Flowering LED
The Growers Choice ROI-FF 650 is purpose-built for the flowering stage, delivering a high-output 1950 µmol/s PPF optimized for cannabis bloom. Its multi-bar form factor provides excellent PAR uniformity across a dense 4′ x 4′ to 4′ x 5′ flowering footprint at the recommended hang height, depending on your target PPFD and CO₂ strategy. Enter its spec-sheet PPF into the calculator’s Advanced mode for the most accurate fixture count.
For vegetative stages or mixed-use rooms, the ROI-FF transitions well — simply raise hang height to expand footprint and reduce peak PPFD for younger plants, then confirm with a PAR map at canopy height.
Growers Choice ROI-E720 LED
The Growers Choice ROI-E720 is the full-cycle workhorse for growers who want one fixture to carry plants from veg through flower. At 720W draw with multi-bar Samsung diode architecture, it delivers total output in the roughly 1,870–2,080 µmol/s range with high µmol/J efficiency, making it suitable for elevated PPFD targets in controlled environments. It’s particularly well-suited to 4′ x 4′ to 4′ x 5′ canopies and supports daisy-chain light controller integration for multi-room automation.
Additional Fixture Options
The Photontek XT 1000 Watt CO₂ Pro LED is engineered specifically for CO₂-enriched environments — use it when running 1,200–1,500 ppm CO₂ and targeting PPFD above ~1,000 µmol/m²/s in a 5′ x 5′ space, or at higher mounting heights for a slightly larger footprint at lower intensity. The
Matrix M6 645 Watt LED offers strong midrange performance for 4′ x 4′ footprints where moderate-to-high PPFD is desired with efficient power draw. For smaller spaces or veg rooms, the
Growers Choice ROI-E420 covers a 3′ x 3′ to 4′ x 4′ footprint with proportionally reduced draw, ideal for lower-intensity stages.
Supporting Tools: Measuring and Monitoring Light
Verifying Your Calculator Results with a PAR Meter
The calculator gives you a solid estimate — real-world verification with a PAR meter is how you confirm it. The PHOTOBIO Advanced Quantum PAR Meter measures PPFD at canopy level across your footprint, giving you a spatial map of light uniformity. Take readings at the center and each edge of your canopy and average them — this is your real-world PPFD; more dense grids provide finer detail for commercial audits. Learn the full technique in our guide on how to measure your grow light with a PAR meter.
Environmental Monitoring
Lighting interacts directly with temperature and humidity — high PPFD fixtures raise canopy temperature, which shifts your VPD target and dehumidification demand. The Grow1 Thermo-Hygrometer with Probe stores Min/Max values so you can track environmental swings between lights-on and lights-off periods — essential data when dialing in a new fixture layout or changing schedules.
Grow Room Electricity Cost
Adding fixtures increases operating costs. Before finalizing your layout, run your fixture count through our Grow Room Electricity Calculator to project daily, monthly, and annual energy expenses — and compare LED vs. HPS lifecycle costs side by side using actual wattage and local kWh rates.
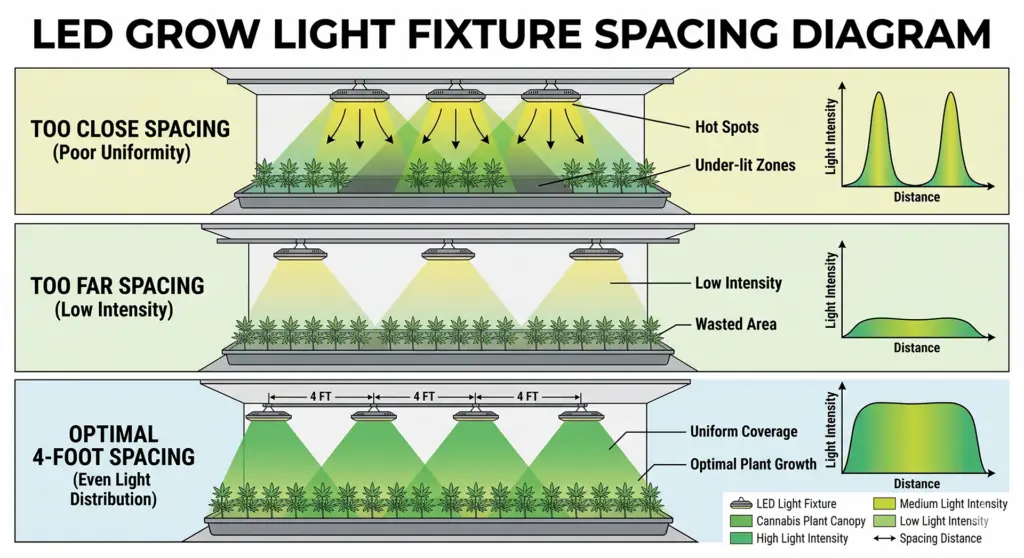
Light Fixture Placement: Maximizing Uniformity
Even with the right fixture count, poor placement reduces effective PPFD and creates hot spots. Follow these guidelines:
- Hang height directly affects footprint and intensity. As you raise a fixture, footprint expands and peak PPFD drops; as you lower it, the inverse applies — coverage tightens and center intensity rises. Most LED manufacturer specs rate coverage at a reference hang height (typically 18–24″); the calculator adjusts based on your actual input, but final verification should come from a PAR map.
- Spacing fixtures 4 feet apart is a strong baseline for multi-fixture setups, but your specific wattage, form factor, and PPF distribution curve will dictate optimal positioning. Use your PAR meter to confirm even coverage after installation and adjust spacing incrementally.
- Overlap (10–20%) in the calculator adds a uniformity buffer at footprint edges. A 10% overlap is suitable for a single-fixture tight canopy; 15–20% is recommended when tiling multiple fixtures to prevent edge drop-off between coverage zones.
- Light movers can extend effective coverage and reduce hot spots in HPS setups, though modern multi-bar LED fixtures with wide-distribution optics largely eliminate the need in most LED environments.
Calculator Quick-Reference: Common Setups
All estimates assume standard CO₂ (~400–800 ppm) and typical fixture efficiencies; higher-efficacy LEDs may hit the same PPFD with fewer watts and sometimes fewer fixtures depending on layout. Run your exact dimensions and chosen fixtures through the calculator for fixture-specific counts, and remember that multiple fixtures generally outperform a single oversized unit for PPFD uniformity on larger canopies.
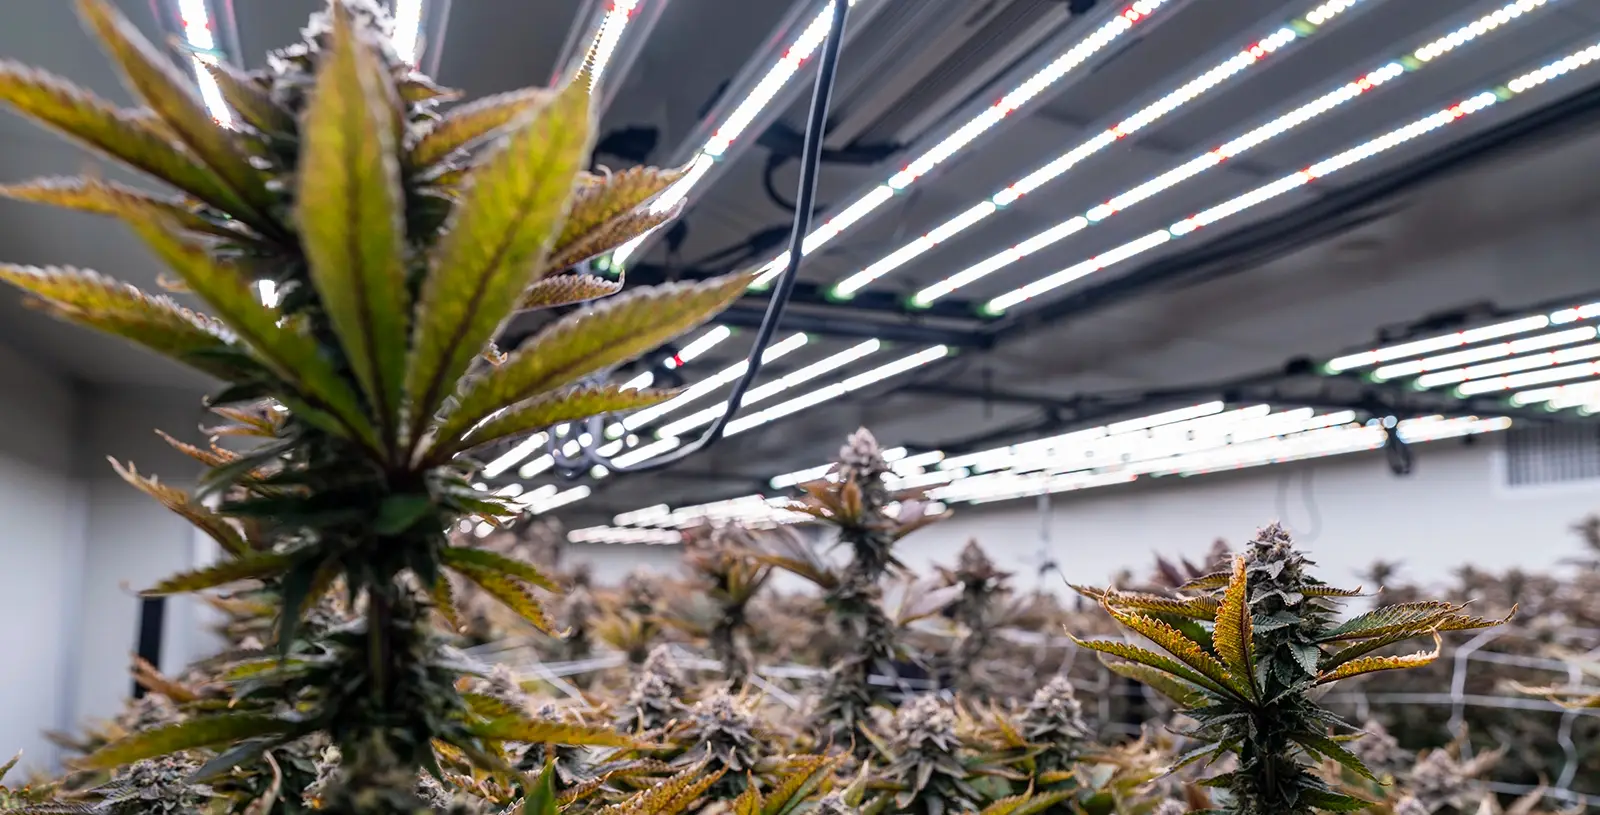
Under-Canopy Lighting: A Layer Above the Calculator
Our coverage calculator focuses on overhead top-lighting — which is the primary light source for most operations. If you’re running a commercial facility targeting maximum yield, under-canopy lighting adds a secondary DLI layer to lower bud sites that overhead fixtures can’t penetrate effectively. Reports from commercial operations and vendor case studies suggest potential yield improvements in the 20–35% range in dense canopies when under-canopy lights are properly integrated with overhead PPFD targets, but actual gains depend heavily on genetics, plant training, and environmental control.
For Commercial Operations: Multi-Room Lighting Workflow
Facility managers scaling beyond a single room need a systematic approach to light planning — not just a per-room calculation.
- Step 1 — Map canopy area per room. Exclude aisles, perimeter buffer, and equipment zones. Most commercial facilities achieve roughly 65–75% canopy utilization of total floor space, depending on layout and local code.
- Step 2 — Set PPFD by room type. Propagation rooms: ~150–300 µmol/m²/s. Veg rooms: ~400–600 µmol/m²/s. Flower rooms: commonly 700–900 µmol/m²/s at ambient CO₂, and 900–1,100+ µmol/m²/s when CO₂ programs and HVAC are designed to support higher intensity.
- Step 3 — Run the calculator per zone. Use Advanced mode with your fixture’s spec-sheet PPF. For uniform commercial deployments, one fixture type across all flower rooms simplifies procurement, spare parts, light mapping, and controller integration.
- Step 4 — Integrate a lighting controller. As fixture counts scale, manual timers become unmanageable. DLC-certified fixtures like the Growers Choice ROI-E720 support lighting controller integration via the Covert 8 Light Relay Controller, enabling zone-level dimming, sunrise/sunset simulation, and multi-room scheduling.
- Step 5 — Verify with a PAR meter post-installation. Never assume a commercial install matches spec. Map PPFD across 5–9 points per fixture footprint and document your baseline; higher-density grids are recommended for licensed facilities. Repeat the verification after any fixture repositioning, replacement, or major canopy strategy change.
- Step 6 — Account for lighting in your HVAC load. Every 100W of actual fixture draw adds roughly 341 BTU/hr of heat to your cooling load as an electrical rule-of-thumb. Coordinate with your HVAC sizing before finalizing fixture counts and distribution so that temperature and humidity can be maintained at your target VPD.
Why Shop Grow Lights at HydroBuilder
HydroBuilder carries the full spectrum of professional-grade grow lighting — from hobbyist LED starters to commercial multi-bar arrays used in licensed cultivation facilities across North America. Our team includes actual grow room builders who can review your calculator output, discuss your facility layout, and recommend a fixture configuration matched to your canopy dimensions, growth stage, CO₂ plan, and HVAC capacity.
Every order ships from our warehouse with the support of growers who understand what you’re building. Whether you’re outfitting your first tent or scaling a commercial facility, we’re here to help you light smarter.
Related Resources